
Posted by Nikolaos Mavrodontis
Table of contents
In this post, we will be highlighting the main features of Simulia's fatigue prediction software, fe-safe. Fe safe performs both strain and stress based fatigue calculations, incorporating many different fatigue algorithms (uniaxial strain and stress based, biaxial strain and stress based, advanced thermomechanical fatigue, elastomer fatigue, fatigue of welds etc.). Last but not least, a fatigue calculation example will be shown. This concerns a notched plate under a cyclic fully reversing (tensile-compressive) load.
Fatigue Basics (Stress or Strain Based)
Fatigue is the failure induced on a material,upon cyclic load action. Unlike a static load failure (e.g. break under a high tensile load), fatigue failure relates to dynamic loads that are repeated. Fatigue is really difficult to predict, as its onset is not visible and fatigue failure happens abrruptly and suddenly. Typically it consists of three stages: crack initiation, crack propagation and fracture,seen in Figure 1.
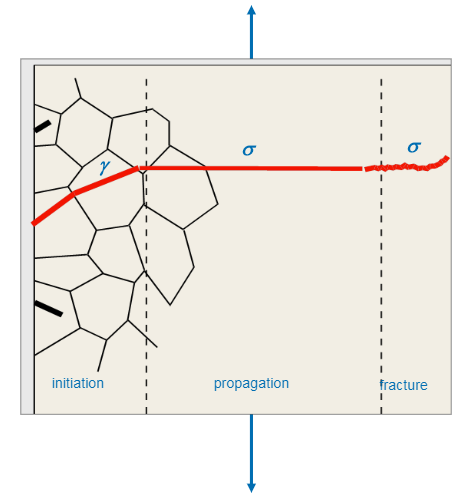
Figure 1: Stages of fatigue.
Historically, in order to be able to calculate the fatigue life of components, engineers resort to S-n curves. This curves have been derived from material testing, under constant amplitude fully reversing loads (tension-compression) under a zero mean stress. Typical examples of S-n curves are given in Figure 2.
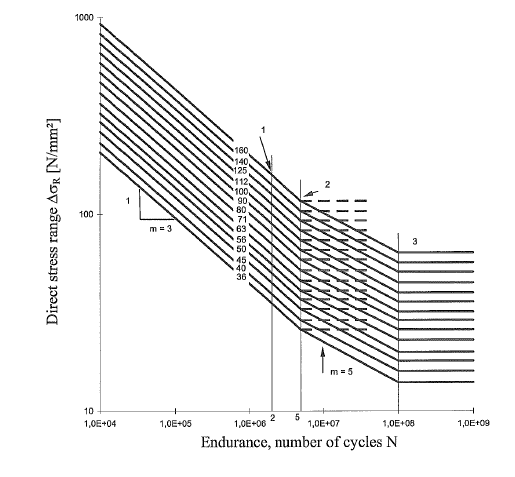
Figure 2: Exemplary S-n curves.
The serious limitation of this methodology, relates to the fact that the theory behind it is based on elastic stresses or equivalently in cases where the irreversible strains (plastic strains) are really limited. This is found to be accurate in most cases, whenever High Cycle Fatigue (HCF) is studied. High cycle fatigue can occur when a component is loaded cyclically under loads with amplitudes lower than the yield of the material (or for Number of cycles >10^5).
However in the Low Cycle Fatigue (LCF) regime, where the load amplitudes are higher, this theory is not the most accurate. This happens as this higher cyclic loading, will result in plastic strains on the material locally, especially in areas that include notches (fillets, radii, cross section changes, surface roughness etc.). What happen locally in those regions, is that due to the presence of the notches, the stresses will exceed yield, and thus cause permanent deformations locally. Fatigue failure is always the product of plasticity, therefore some irreversible deformations are required for fatigue failure to occur.
Therefore, accurately predicting the fatigue life in the LCF regime, requires some assessment over the strains that develop on the material and a plasticity correction that will consider the change in fatigue life due to those strains. The fatigue theory developed to incorporate this assessment, is called strain based fatigue theory. It is not yet so popular, as it requires strain based testing which is typically more expensive than stress based testing (S-n curves are derived from that). S-N curves are readily accessible and more engineers are familiarized with the S-n method.
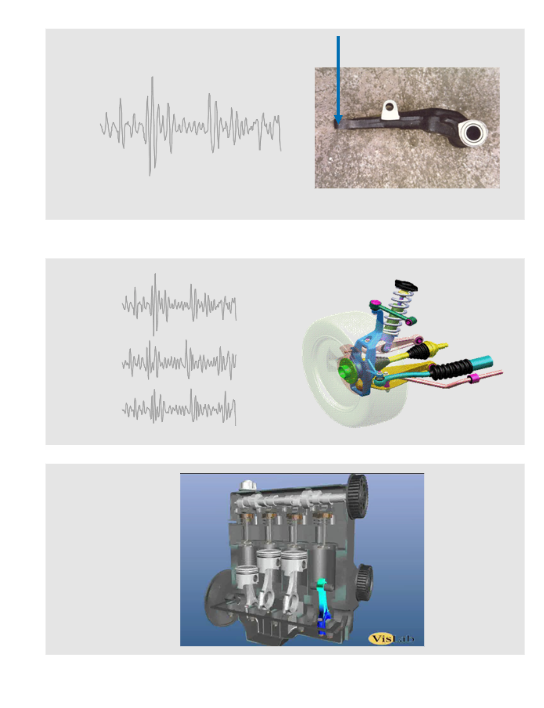
Another important aspect of fatigue related failure, is the type of cyclic loading that acts upon the structure. We mentioned that the S-N curves are the product of laboratory testing on smooth specimens, under uniaxial fully reversing tensile-compressive loading. However in real-life structures, uniaxial stresses rarely occur. Additionally, fully reversible loads are rare in modern engineering components. They occur on some components (axle components, sliding components of gearboxes etc) but there are many engineering structures that are under load action not fully reversing but rather fully relaxed (max tension, zero load, max tension etc.) or non-relaxing (rubber seals).
A graph of two different types of loading, is given below in Figure 3. for the fully relaxing load, the mean stress ( average of max, min stresses) is tensile. For the fully reversing load, similar to S-N curve testing), the mean stress is equal to zero.
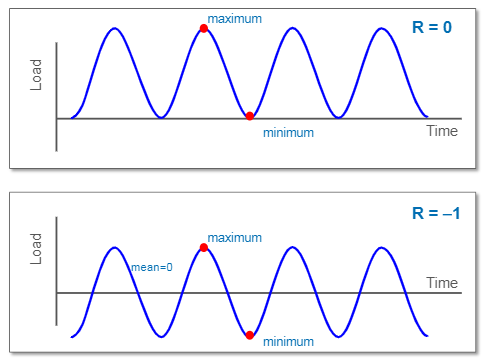
Figure 3: Fully relaxing and fully reversing cyclic loads.
It is well known and proven, that having a tensile mean stress deteriorates fatigue life, compared to a load history with a zero mean stress. Therefore in order to accurately predict the fatigue life of our component, given that the load action is not fully reversing, we need to perform a mean-stress correction that can result in a decreased or increased (when the mean stress is compressive) fatigue life. For stress based methods, the Goodman diagram is used. This is a graphical method to be used in conjuction with the S-N curve in order to make a stress-based fatigue assessment of a real life component. Strain based methods incorporated in fe-safe, can make the plasticity and mean stress corrections in a more accurate way, compared to stress based fatigue methods. Strain based methods are available for both LCF and HCF, whereas stress based methods should only be used in HCF.
Last but not least, strain based methods are crack initiation fatigue theories. This means that a life prediction is made up till the moment of crack initiation ( crack propagation and failure will follow). Stress based methods are total fatigue life theories, meaning that they provide a fatigue life prediction on the entire lifetime of the component and not only up till crack initiation. Of course fe-safe can perform fatigue calculations according to both theories (stress based and strain based). The software addtionally includes extensive material libraries, wherein corresponding S-N curve data and strain based test data are readilly available for the user.
Fe-safe Case Study
FEA Model and Case Study Details
Fe-safe can calculate fatigue life from both elastic and elastic-plastic FEA if needed. The latter is supported only as a dataset sequence loading and it is meaningful when there is contact taking place in an FEA model as well as when gross plasticity is occuring, modifying the load paths.More information on how/when to use elastic plastic FEA with fe-safe can be found in the knowledge article (QA00000029000).
For the damage accumulation, caused by different load histories, fe-safe uses Miner's rule.
As an exemplary case study, a planar notched plate of 50x30 mm (notch radius=3 mm), will be put under static unixaxial tension. The fea model is linear elastic. The respectful loads and BCs of the model , can be seen in Figure 4. It is noted that a unit stress of 1 MPa is applied on the plate. The unit stress will be scaled up and assigned a load history (a sinusoidal fully reversing signal) within fe safe. When the Abaqus job for the linear elastic model is complete, we can append the *.odb as input into fe -safe.
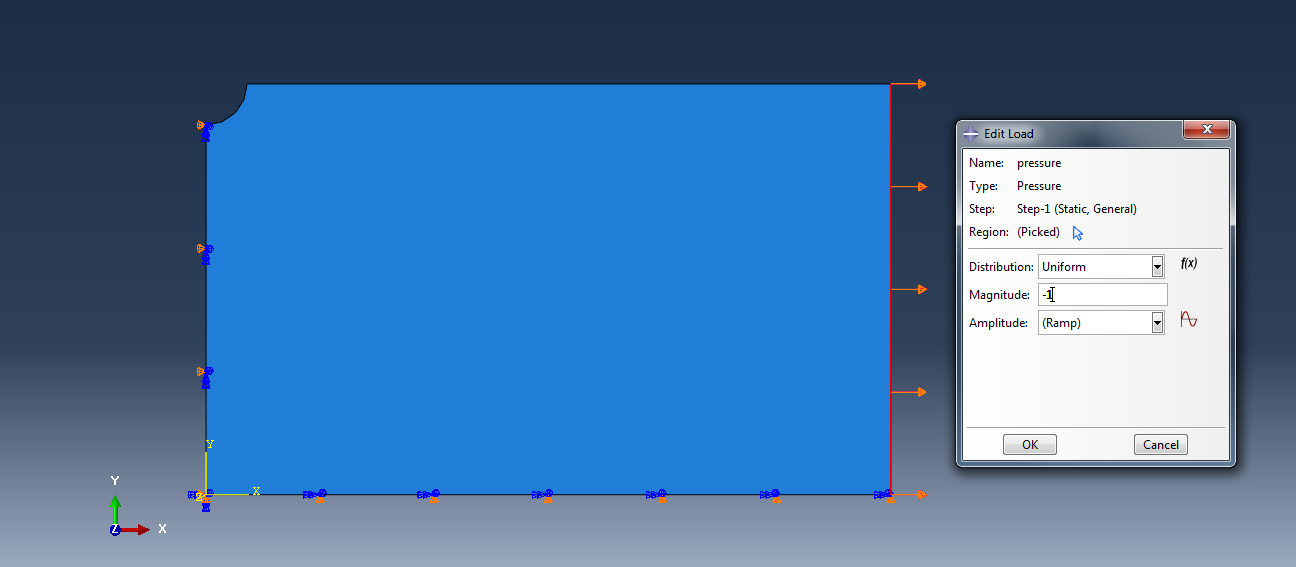
Figure 4: Loads and BCs of fea model.
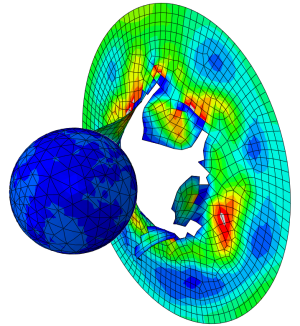
Figure 5, shows contour stresses at the end of the static step in Abaqus. Although the loading and boundary conditions are unidirectional for the model, a resulting bidirectional stress state is evident, due to the presence of the notch. Fe-safe uses the tensorial stresses to calculate fatigue (and not the von Mises stress shown).
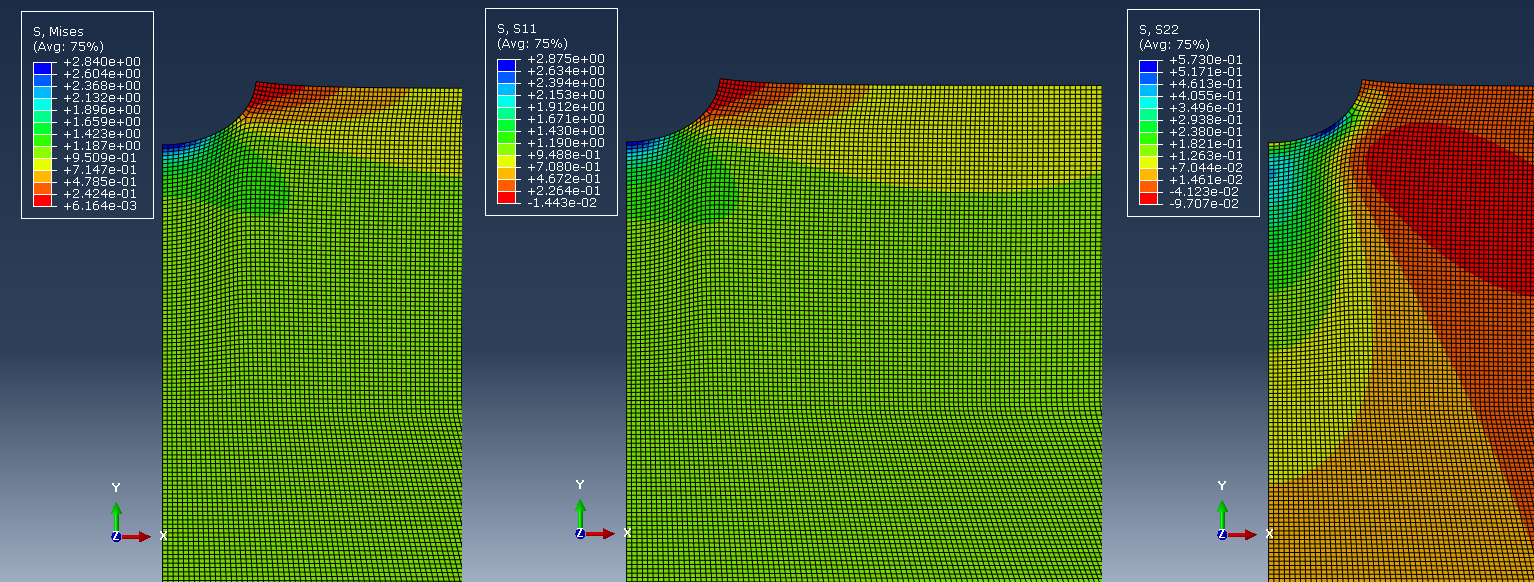
Figure 5: Stress measures at the end of static step analysis in Abaqus.
Loading Methods in Fe-safe and Setup of Case Study
Fe-safe supports various loading methods. The most commonly used (but not only ones available) , are shown in Figure 6 below.

Figure 6: Most commonly used loading methods fe-safe.
From top to bottom in Figure 6:
Single load history (scale and combine)
Multiple load history (scale and combine)
Dataset sequence loading
For our case study, a single tensile unit stress was applied in the fe model. Infe-safe we will need to scale this unit stress up to almost yield levels (300 MPa) and to couple it with a sinusoidal signal, in order to produce our fully reversing load cycle. We will need the single load history option in fe-safe. If we had additional loads acting on the plate, having the same or even different directions, we would be able to calculate the fatigue life via the multiple load history option in fe-safe.
The process that was described above, is shown graphically, in the following figures.
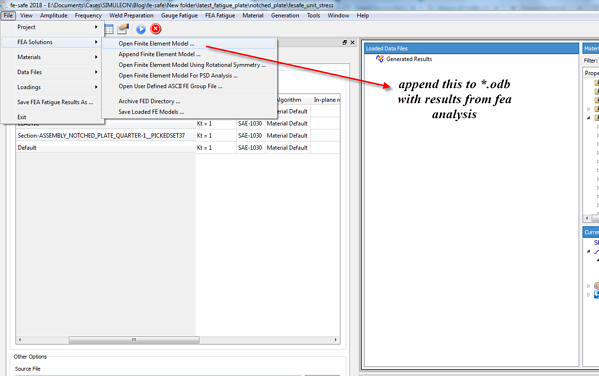
Figure 7: Append to fea results.
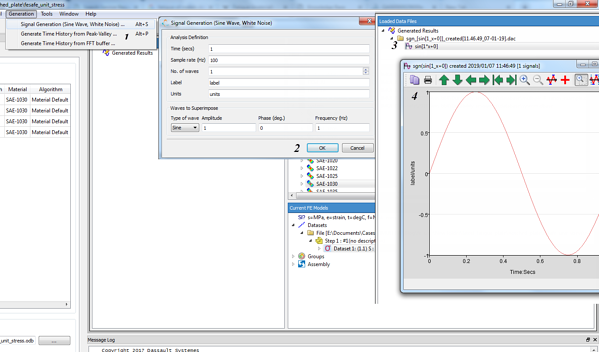
Figure 8: Generate loading signal.
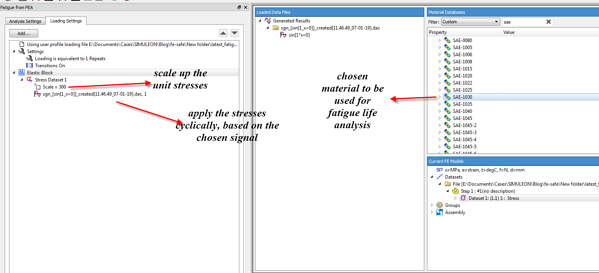
Figure 9: Fatigue loading settings and material.
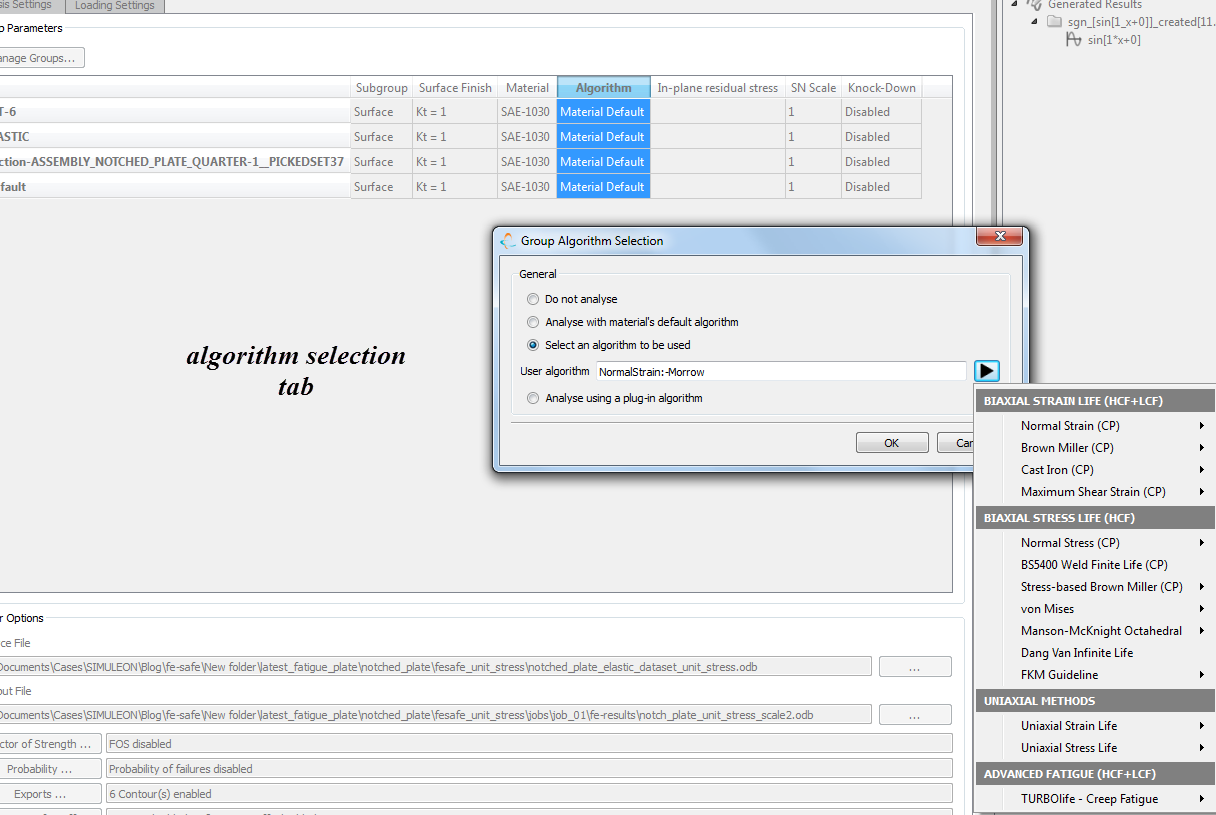
Figure 10:algorithm selection tab.
The predicted log lifes using, biaxial stress life with plasticity correction, uniaxial stress life (normal stress) with no plasticity correction and biaxial strain life will be demonstrated for the notch plate. The predicted lifes are written as *.odb and can be directly post processed in Abaqus. Figure 11 shows comparative results of the fatigue life prediction in log scale. The results have been produced by different algorithms (strain and stress based).
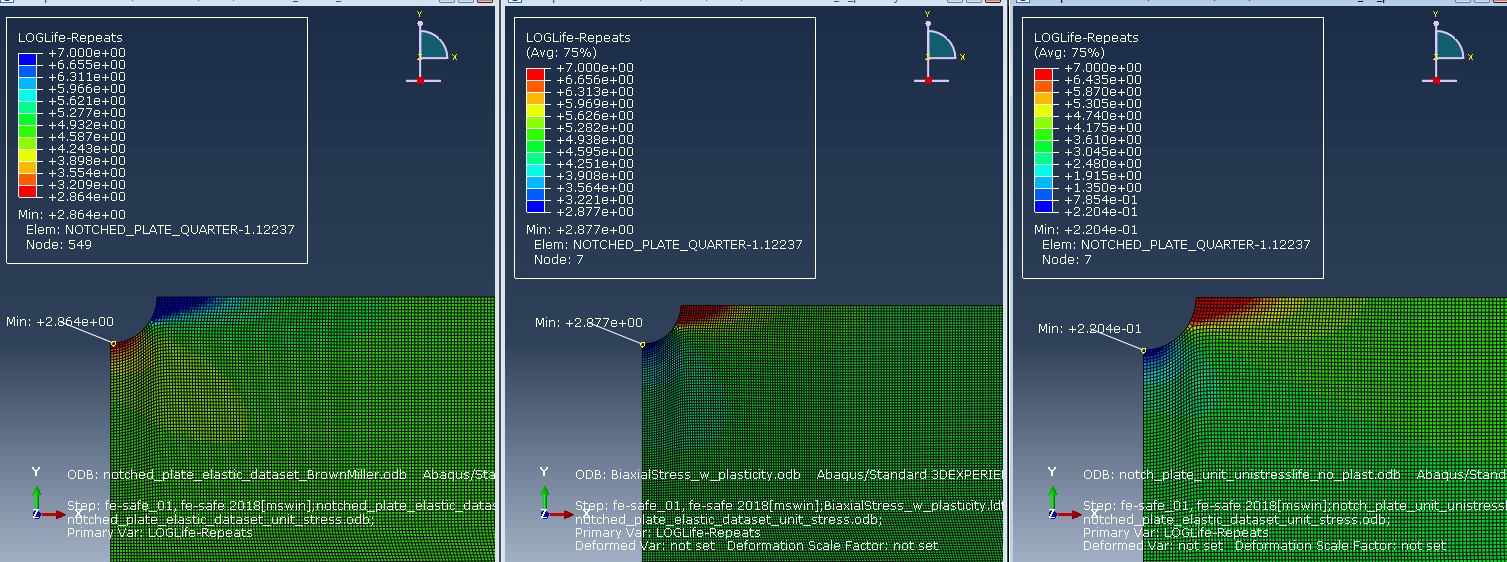
Figure 11: Fatigue life predictions notched plate.
| Algorithm used | Lowest Predicted life | Repeats |
| Brown Miller strain based | 2.86 (node 549) | 724 |
| Biaxial stress life (normal stress) -with plasticity correction | 2.9 (node 549) | 794 |
| Uniaxial stress life - no plasticity correction | 0.22 (node 549) | 1.65 |
As a reminder, the external load level in our case study is high, almost at yield levels, therefore this is a case study of Low Cycle Fatigue (LCF).
In terms of accuracy, the Brown miller strain based algorithm is the most advanced strain based algorithm within fe-safe, for assessing ductile metals.
A biaxial stress based algorithm with plasticity correction is a stress based algorithm . This should only be used for HCF, however the plasticity correction that is not included in a typical S-N curve fatigue analysis, seems to give a reasonable prediction in terms of repeats until failure, compared to the Brown miller algorithm. We need to always keep in mind, that stress methods predict life to fatigue failure whereas strain based methods (such as the Brown miller) predict life to crack initiation.
Last but not least, if we assess the fatigue life of the notched plate with a traditional uniaxial S-N curve method (available in fe-safe but advised to be used only for HCF), we can immediately see the effect on the predicted life. Stress based methods (S-N curve) on the LCF regime, are always too conservative (underpredict) fatigue lifes as they lack the plasticity correction (thankfully fe-safe can account for this), effectively leading to oversizing of components in order to account for fatigue.


TECHNIA Simulation provides top tier FEA, Non-linear, and Advanced Simulation Software, Training, and Consultancy. Our dedicated team of more than 65 Simulation experts across 16 countries advise and support your innovation with a wealth of specialist knowledge and experience.
About TECHNIA- Related news and articles straight to your inbox
- Hints, tips & how-tos
- Thought leadership articles
Helping you find the information you’re looking for. Discover webinars, events, FAQ's, case studies and tutorials.
VIEW HUB