
Posted by Christine Obbink-Huizer
Table of contents
Five years ago, we posted a blog about analyzing a PET-bottle, including a top load analysis performed with Abaqus. This type of analysis is used to determine the maximal force a bottle can withstand under axial loading. In the current blog I want to revisit the topic, and focus specifically on materials properties. Often these are not readily available. Perhaps a data sheet is present, specifying a Young's modulus and a Yield stress (if you're lucky) but not the actual stress-strain data. Here we'll take a look at the impact of using limited material data on the limit load in a top load analysis.
Geometry
The geometry used is shown below (Figure 1). I couldn't locate the previously used version, so I downloaded the (same) geometry from GrabCAD.
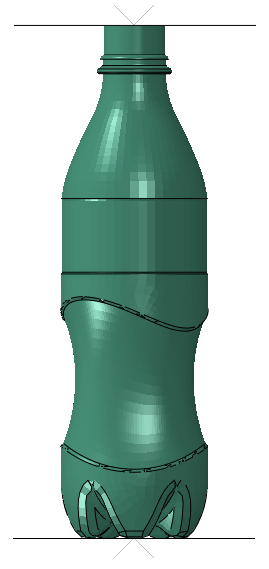
Figure 1: Geometry.
The geometry includes the bottle, as well as two plates. The top plate will be pressed down so that the bottle is pushed against the floor.
The top part of the bottle is modelled using solid elements, so the more complex shape can be taken into account. The bottom part is modelled using shell elements, for a more efficient analysis. They are coupled via a shell-to-solid coupling. The plates are modelled as analytical rigids.
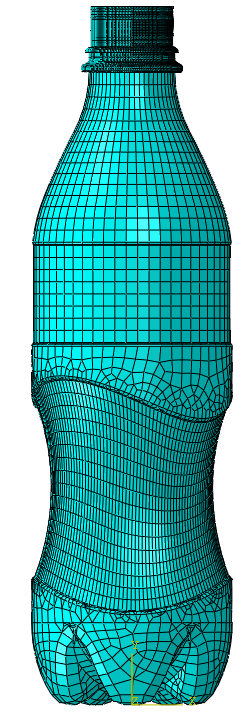
The mesh on the bottle is shown below (Figure 2), the plates don't require meshing.
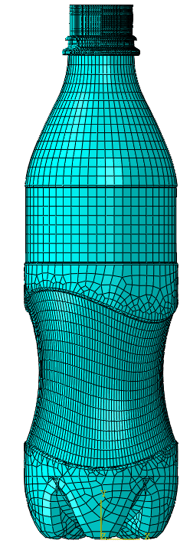
Figure 2: Mesh.
Material Properties
Material properties were derived from literature. This article provides stress-strain data for different PET materials at different temperatures. Data for regular PET (no coating) at 27 degrees Celsius was used. Four different material defintions were used:
- elastic (based on the Young's modulus provided in the article)
- elastic - perfectly plastic (based on the Young's modulus and yield stress provided in the article)
- elastic - plastic, same Young's modulus as above (using stress-strain data from the article)
- elastic - plastic (using stress-strain data from the article, Young's modulus not restricted)
Here number 1 is the simplest description; this data is usually available. It assumes there is no plasticity: the same linear elastic stiffness is always active. Number 2 is still rather simple, but does include plasticity. It excludes any hardening, so once the yield stress is reached, the stress stays constant, while the plastic strain increases. Number 3 is closer to reality and includes the actual stress-strain curve. The Young's modulus is chosen so that it matches the previously used Young's modulus, to make results more comparable. Number 4 matches the fit of the data that I would make if I were to determine the Young's modulus from the stress-strain data.
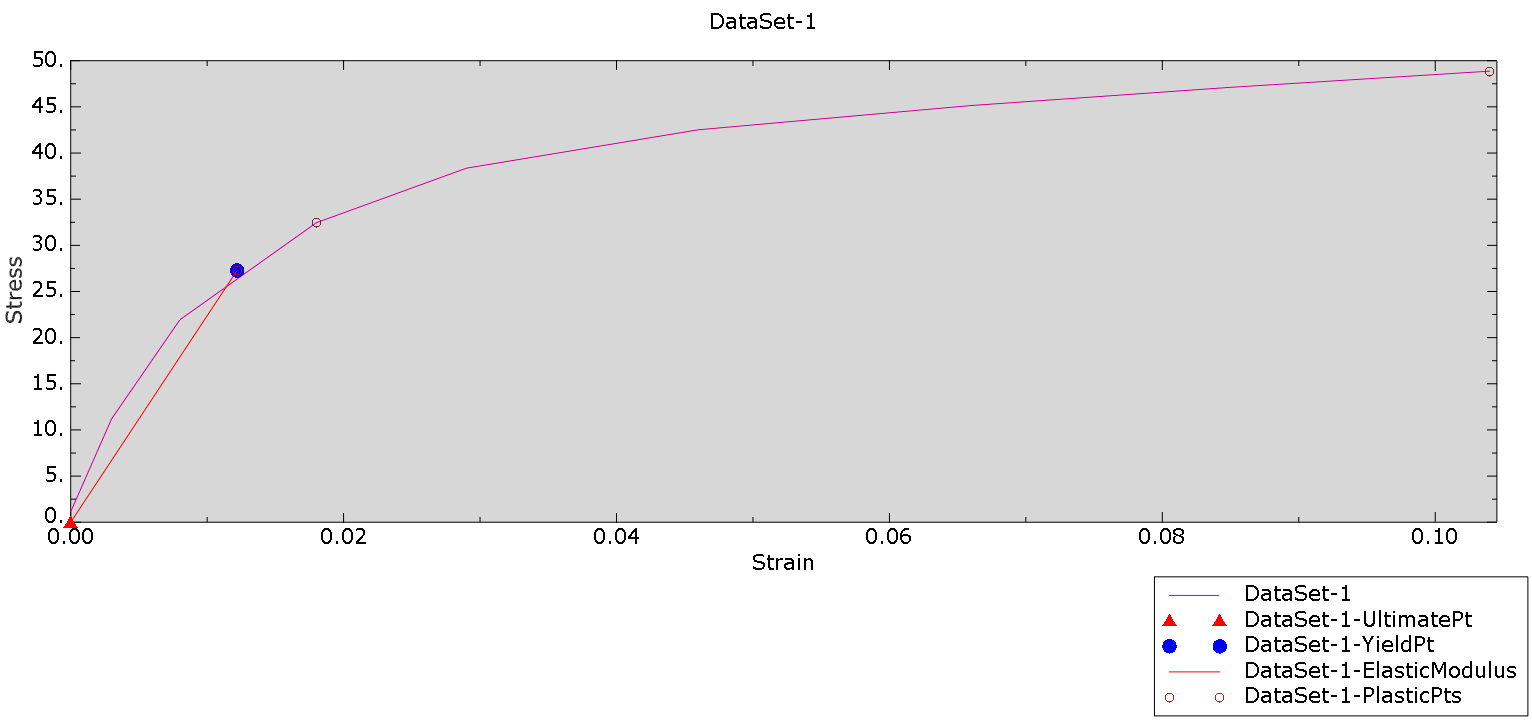
Figure 3: Stress-strain graph including points used to define material 3. Notice the initial red line indicating the Young's modulus.
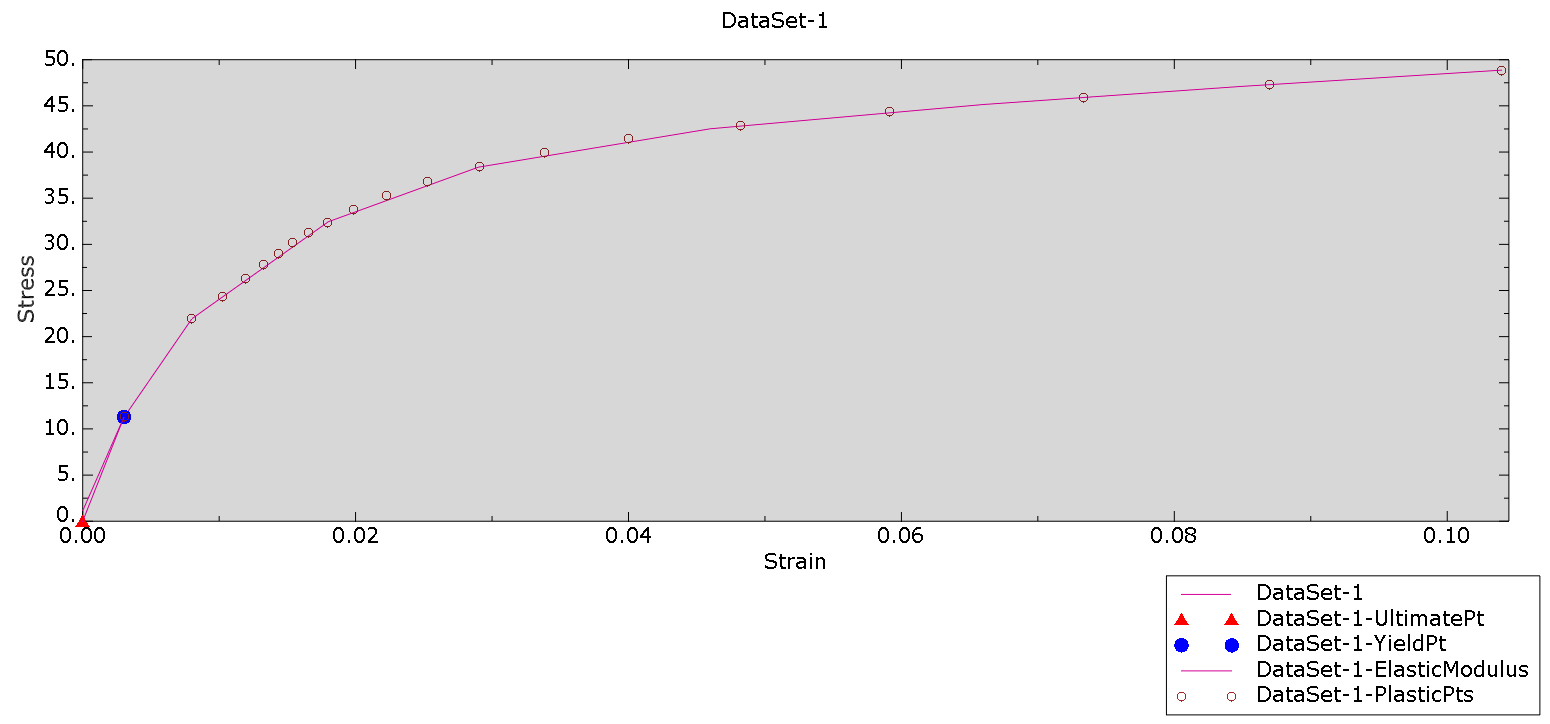
Figure 4: Stress-strain graph including points used to define material 4.
An overview of the data used, is given in Table 1.
Table 1: Material properties used.
| material 1 | material 2 | material 3 | material 4 | ||||||||||||||||||||||||||||||||||||||||||||||||||
| Young's modulus (MPa) | 2250 | 2250 | 2250 | 3729 | |||||||||||||||||||||||||||||||||||||||||||||||||
|
poisson's ratio (-) |
0.34 | 0.34 | 0.34 | 0.34 | |||||||||||||||||||||||||||||||||||||||||||||||||
|
plasticity data [stress (MPa) | plastic strain (-)] |
|
|
|
Model Set-up
A displacement in vertical direction is applied to the top plate. Contact with a friction coefficient of 0.3 is applied between the top plate and the bottle, and between the bottom plate and the bottom. The analyses fail because the maximal amount of increments is reached before the maximal applied displacement is reached. The limit load has been exceeded at this point.
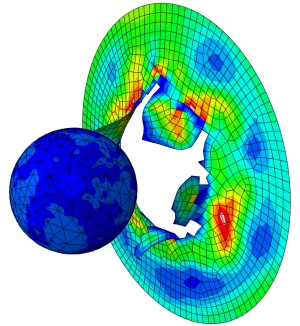
Results: Mises Stress Animation
An animation of a contour plot of the Mises stress is shown in the movie below.
Animation 1: Top load analysis with 4 different material models. Material definition 1 (elastic), 2 (elastic-perfectly plastic) 3 (elastic-plastic with hardening and the Young's modulus used for 1 and 2) and 4 (elastic-plastic with hardening; Young's modulus extracted from stress-strain curve) are shown from left to right. The maximal stress in the legend is set to the yield stress (28.85 MPa) in all cases.
The deformation with these material models is not exactly the same: using elastic-perfectly plastic material properties (material 2), the bottle twists as well as buckles. With elastic material properties (material 1) this does not happen.
As expected, the stress is much higher using the elastic material model.
Animation 2: Top load analysis with elastic material. The maximal stress in the legend is now set to the maximal stress value during the analysis of 600 MPa.
Results: Force-displacement Graphs
Figure 5 shows a force-displacement plot for each of the analyses.
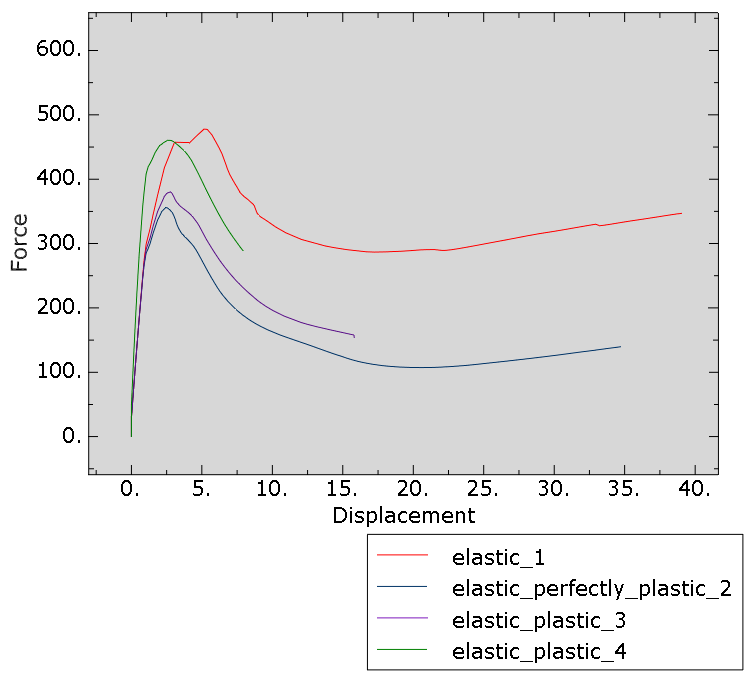 Figure 5: Figure 5: Force (N) - displacement (mm) graph for all four different materials.
The limit load derived from the analysis is highest for the elastic material (1), closely followed by the elastic-plastic material using the stress-strain curve directly (4). For the elastic-perfectly plastic material (2) the limit load is lowest.
The corresponding limit loads are given in Table 2.
Table 2: Limit load for each material definition.
| Limit load (N) | Relative difference compared to 4 | |
| Material 1 (elastic) | 478 | 4% |
| Material 2 (elastic- perfectly plastic) | 356 | -23% |
| Material 3 (elastic - plastic) | 380 | -17% |
| Material 4 (elastic - plastic) | 460 |
Results: State at Limit Load
For all analyses, the stress state at the limit load is shown in figure 6.
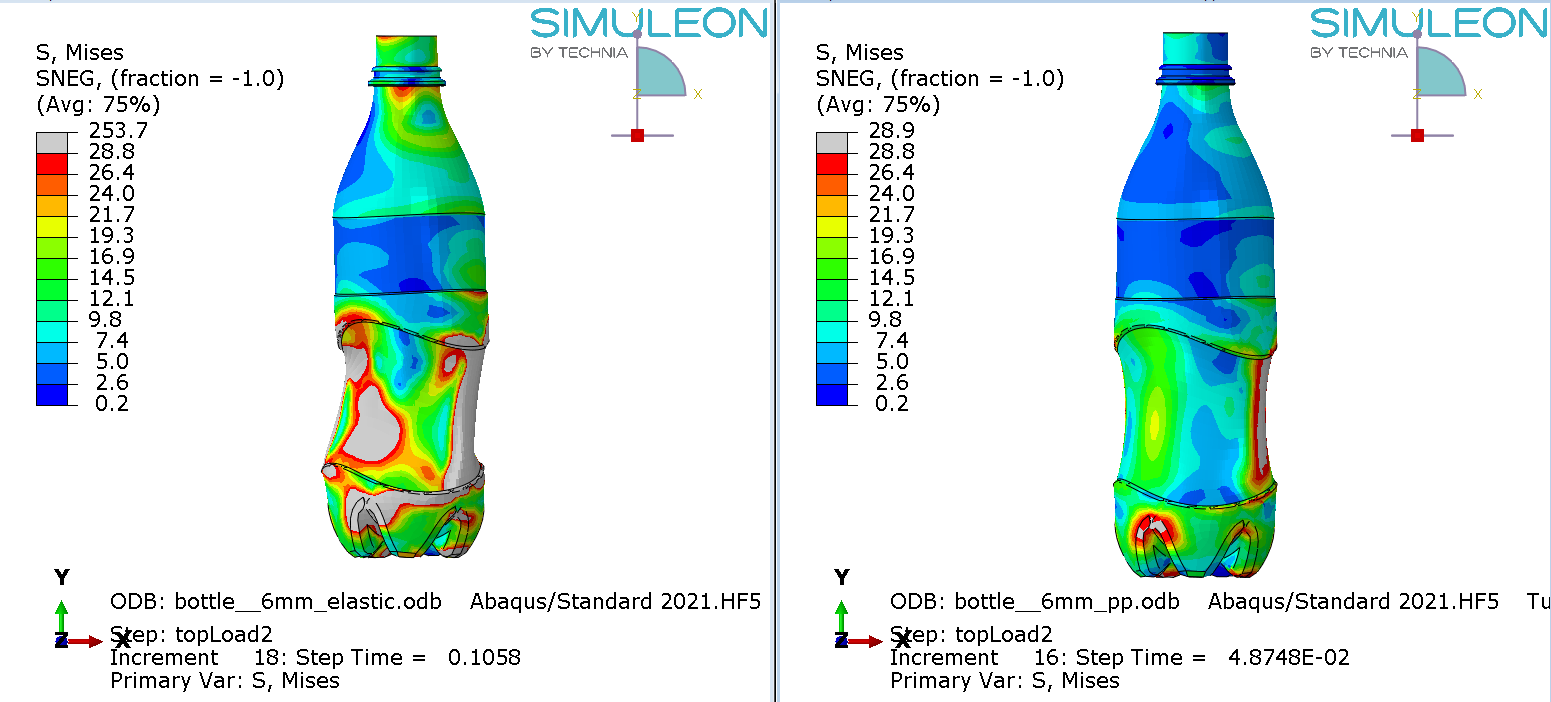
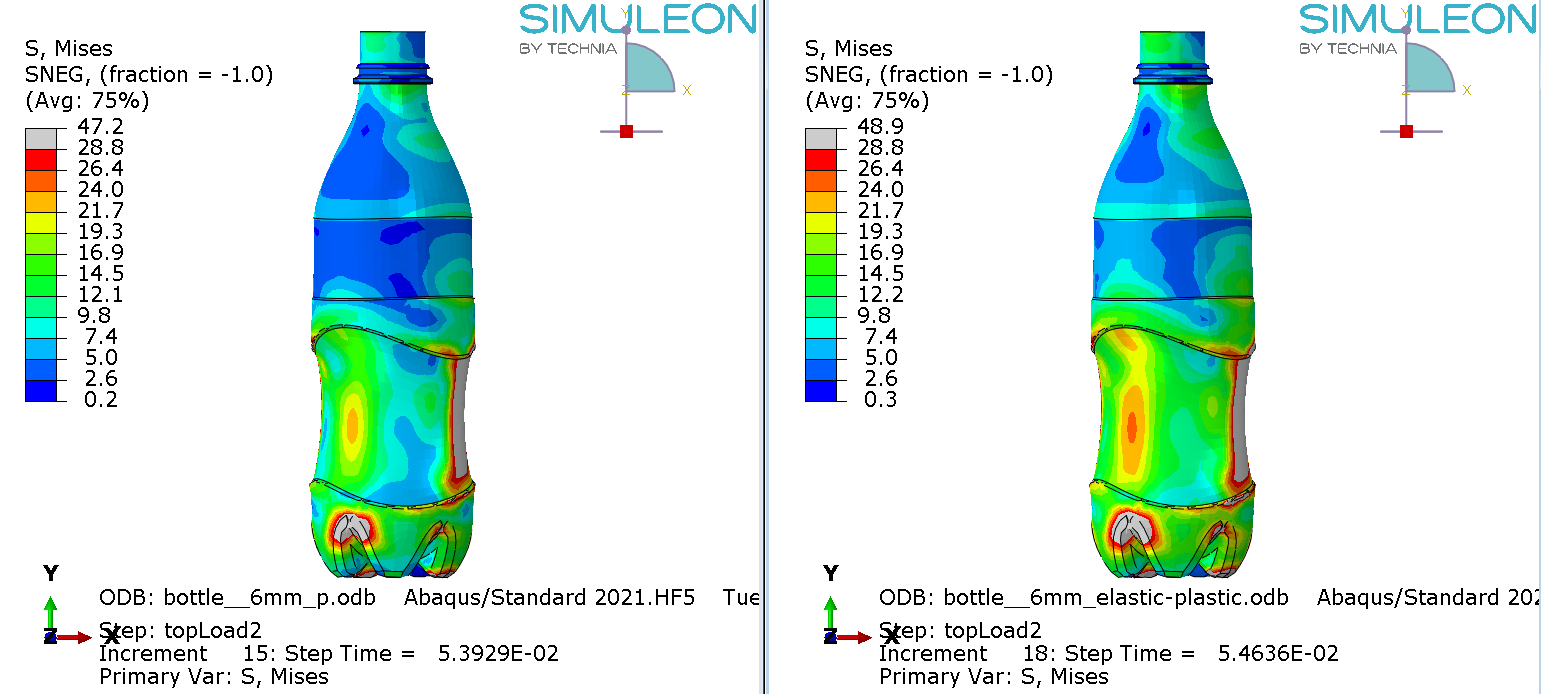
Figure 6: Mises stress at the limit load for material definition 1(top left), 2 (top right) 3 (bottom left) and 4 (bottom right). The maximum legend scale matches the yield stress.
For the elastic material (1) the limit load occurs at a larger displacement and buckling has clearly progressed further. In the other cases the buckling shape is similar, though stress levels differ.
Discussion
So, what does this tell us? Of course this is only one example and the impact of using different material definitions depends on the the exact problem at hand. Still, this example can provide some insight into what can happen.
In a top load analysis the bottle buckles under the limit load, which is a geometrical non-linearity. This is the most important non-linearity in the analysis. Because of this, it may be tempting to stick to a linear-elastic material model. This significantly overestimates the stresses in the material. In this case the limit load was (accidentally?) rather close, though the displacement at which this load occurs is much further off. Because the limit load estimated this way is too high, this is not a conservative approach.
Assuming perfect plasticity, on the other hand, underestimates the limit load of the bottle. Though this is safer to do, the 23% difference observed may be worth the effort of material testing.
When comparing both elastic-plastic definitions, there is a rather large difference (17%). The plastic stress-strain definition is (approximately) the same in both cases, the elastic Young's modulus isn't: it is more than a factor 1.5 larger in material definition 4, compared to material definition 3. Since most of the material is below the yield limit at the limit load (Figure 6), this impacts the results of the analysis. For non-linear materials the effective Young's modulus depends on the load level. Simply using the value on a data sheet may therefore not be representative of the load level in your analysis.
Ultimately, a comparison to experimental results should be made to determine the accuracy of different modeling approaches.
Conclusion
Material properties impact results. Though it may be challenging to obtain suitable material data, it can be worth the effort by allowing more accurate results. For this type of analysis, using elastic properties will overestimate the limit load, while perfectly plastic data will underestimate it (and therefore give a conservative value). Calibrating the material definition based on stress-strain data is expected to provide the most accurate results.


TECHNIA Simulation provides top tier FEA, Non-linear, and Advanced Simulation Software, Training, and Consultancy. Our dedicated team of more than 65 Simulation experts across 16 countries advise and support your innovation with a wealth of specialist knowledge and experience.
About TECHNIA- Related news and articles straight to your inbox
- Hints, tips & how-tos
- Thought leadership articles

Helping you find the information you’re looking for. Discover webinars, events, FAQ's, case studies and tutorials.
VIEW HUB